Profile Picture

About Me

I will graduate from the University of Nevada-Reno with a degree in Computer Science and Engineering, along with a minor in Mathematics. I am an honors student while also participating as a student-athlete for the university. I am now actively pursuing a career as a data analyst

Projects

NCAA analysis

Dashboards

Project 1

FOA dataset python project

Project 1

NCAA division 1 analysis

Dashboards

Dashboard 1

This dashboard was made in Power Bi.

Primary KPI's:
  1. Total Casualties and Total Accident values for year 2022 and YoY growth.
  2. Total Casualties by Accident Severity for year 2022 and YoY growth.
Secondary KPI's:
  1. Accidents with respect to Vehicle type.
  2. Monthly trend showing comparison of accidents for 2021 and 2022.
  3. Accidents by Road Type for 2021 and 2022.
  4. Accidents by Area/ Location, Day/ Night, and Junction Details.
  5. Accidents per local authority.
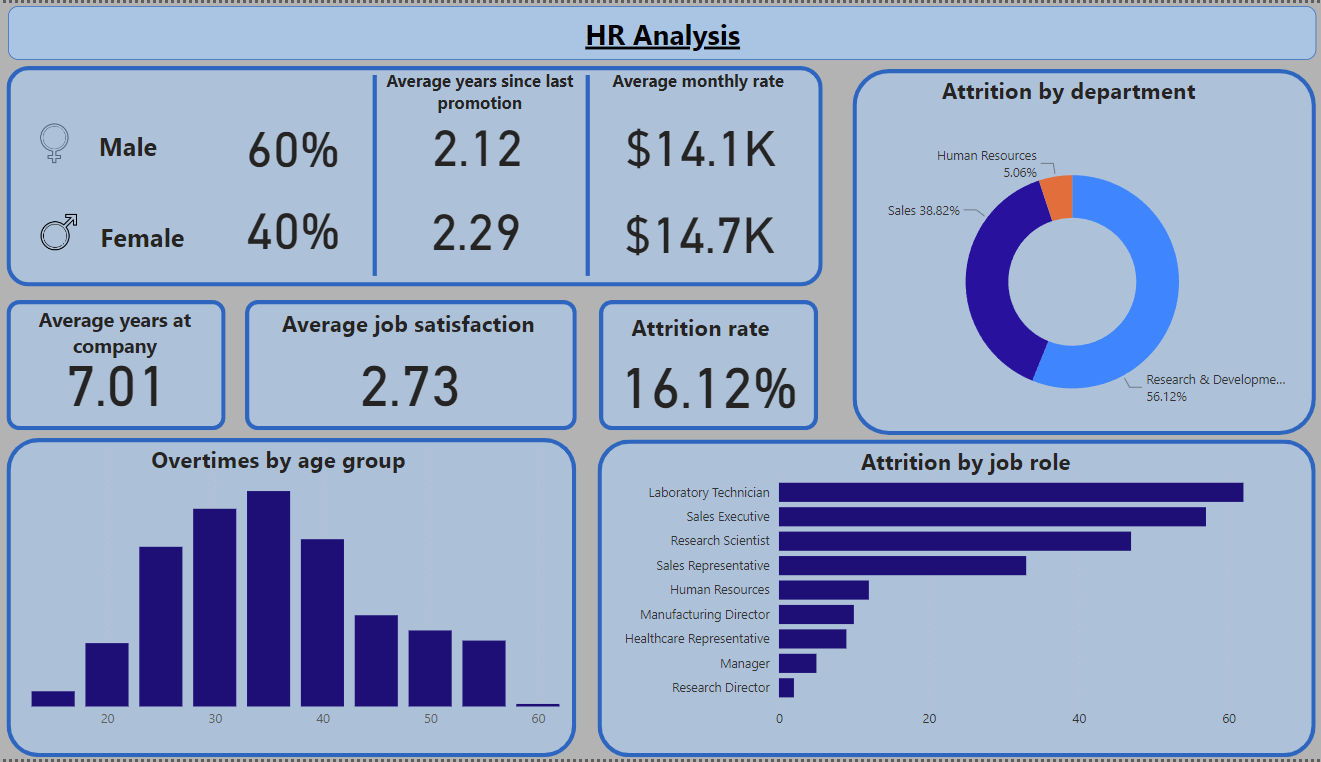
Dashboard 2

This dashboard was made in Power Bi.

Primary KPI's:
  1. Total Employees (by gender).
  2. Average Years Since Last Promotion (by gender).
  3. Average Monthly Rate (by gender).
Secondary KPI's:
  1. Attrition Rate.
  2. Average Years at Company.
  3. Accidents by Road Type for 2021 and 2022.
  4. Average Job Satisfaction.
Other problems:
  1. Attrition by department.
  2. Overtime by age group.
  3. Atrrition by job role.
Dashboard 3

This dashboard was made in Excel.

Primary KPI's:
  1. Total sales.
  2. Total profit.
  3. Profit percentage.
Secondary KPI's:
  1. Profit per Month for 2019 and 2020.
  2. Profit per Category.
  3. Top Customers by Profit.
  4. Top Sales Managers by Profit.
  5. Top Sales Representatives by Profit
Arrow

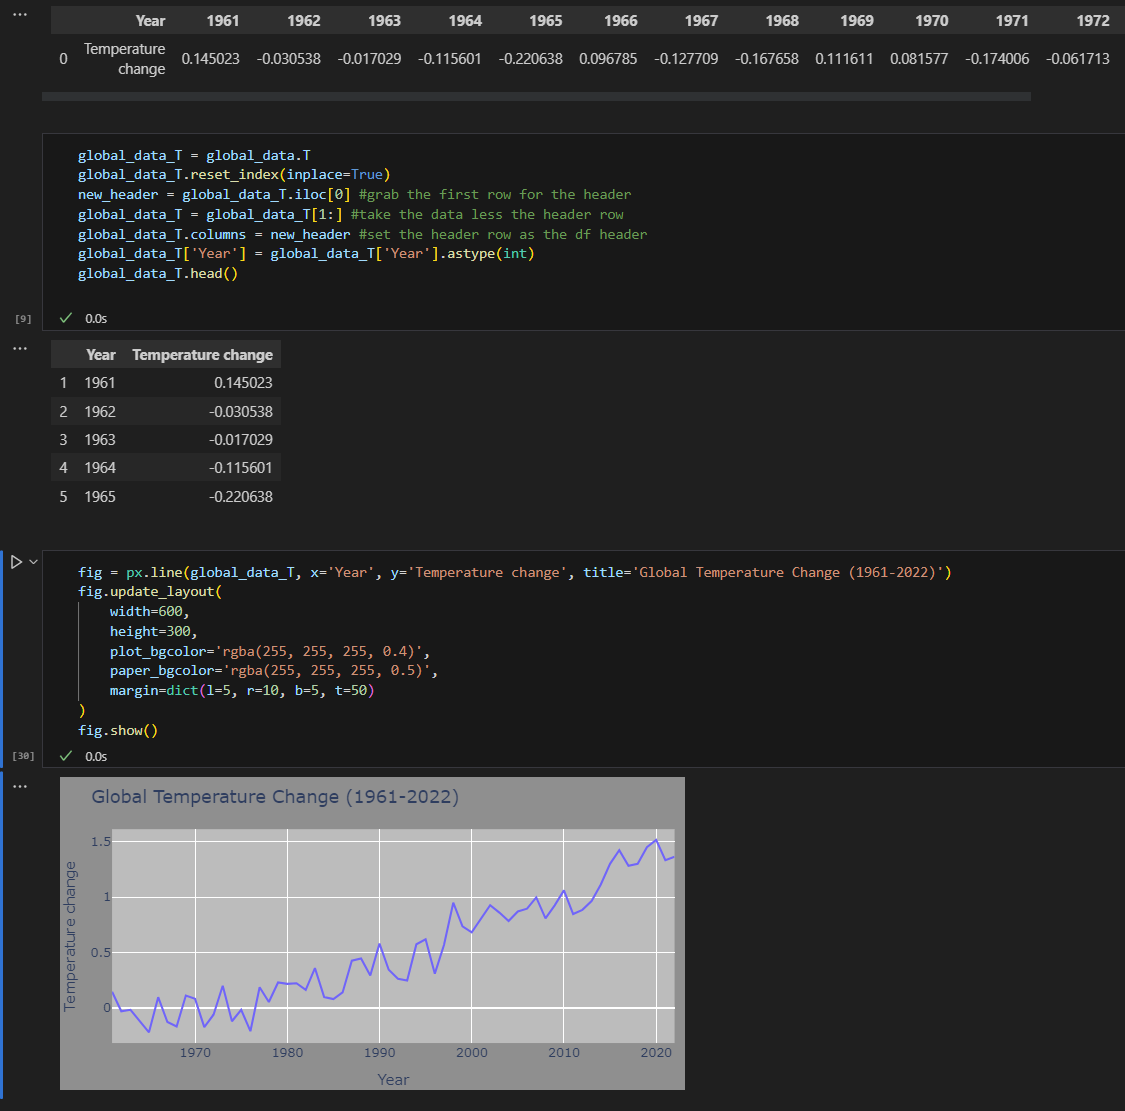
Temperature changes

I used data from the Food and Agriculture Organization's FAOSTAT database and analyzed globally, yearly, nationally etc. trends in Python, using Pandas.

Image 1
Image 2
Image 3
Image 4
Image 4
Image 5
Image 7
Image 8

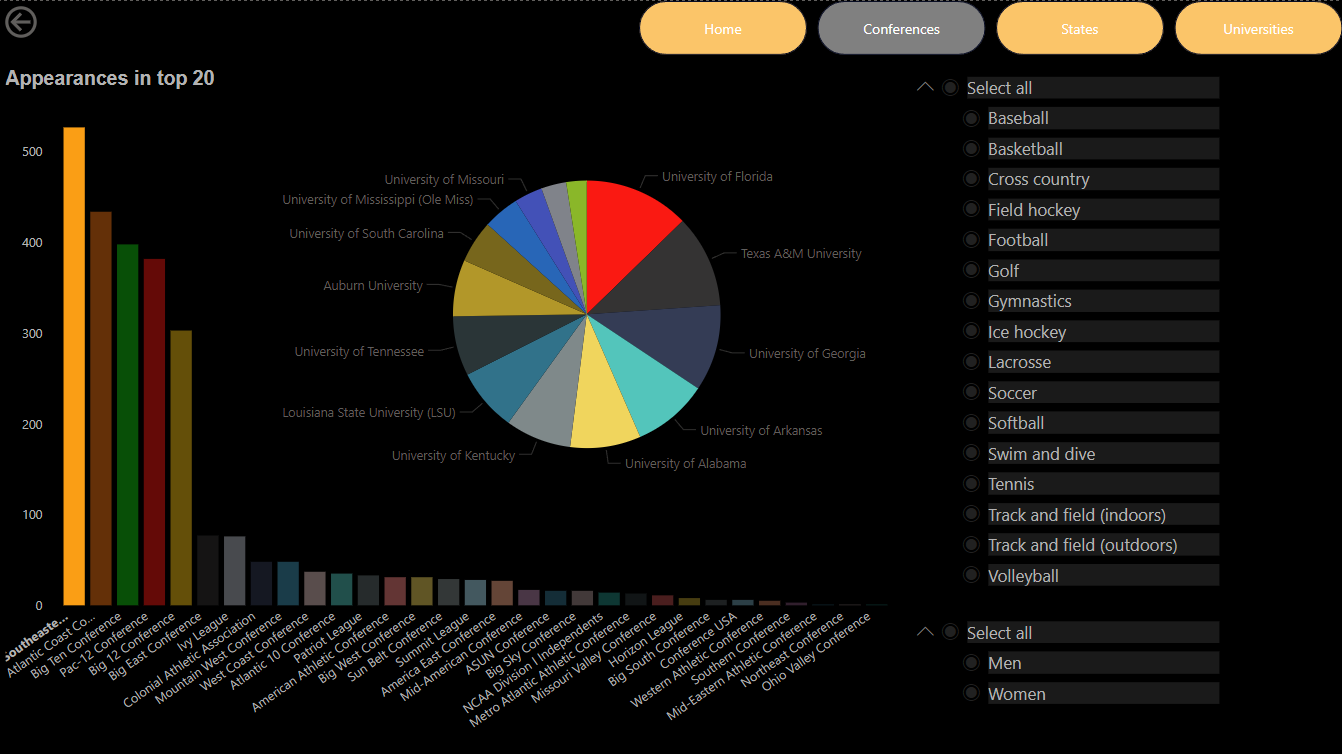
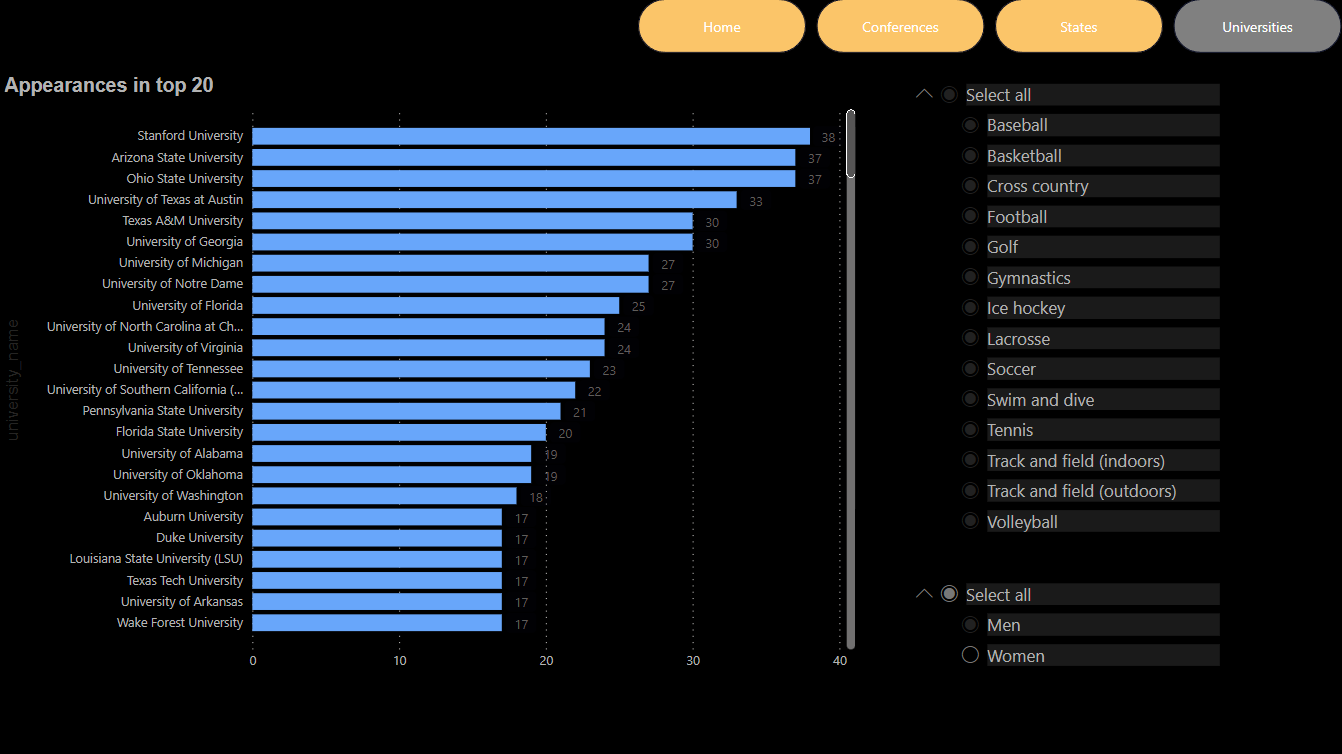
NCAA division one descriptive analysis

Collection, analysis and visualization of NCAA's division 1 top 20 rankings, using SQL and Power BI , that provides insights into statistics and dynamics over the past five years.

Image 1
Image 2
Image 3
Image 4
Image 5
Arrow

Contact Me